Have you a daughter?
 I have … and nieces …
“Whassat then?”
“Well you know that worldwide, Muslims go on a violence fest every Ramadan?”
“Yyyeeeeeess.” (and they do: Religion of Peace recorded 245 attacks last month, 45 in Thailand alone, and look at Paris, apparently every year now – Brussels too this year).
“So why not get a calendar converter for the Muslim calendar/our calendar, a list of their celebration dates throughout the Muslim year, and check against crime figures based on our year, then do a calendar conversion to see if there are any bumps in the crime stats coinciding with those celebrations? Any regularities may not show up on our calendar, but on theirs, who knows?”
“{thinks … er … what crime stats?}”
“Then if you find anything you can do what you did with the Terror Attacks stats.”
“{thinks … this conversation could lead places …}”
“Good idea, I’ll take a look around, see if there are any possibilities.”
Next day a link to a good calendar converter appeared in my e-mail. Thank you Gandalf. Turns out what I eventually discovered is far better – worse – than Gandalf’s suggested possibility … and I didn’t need the calendar converter; the relationship between Muslims and crime wasn’t that subtle.
First I went looking for suitable crime statistics.
Aside …While I was compiling my earlier posts on Terror Attacks Worldwide, I tried to access more information than RoP’s, from the C.I.A.; from there I was re-directed to the State Department, where their terrorist attack data was inaccessible owing to “Technical Difficulties”. Hmm, yes, ok. I learned a lesson from that, and just on the off-chance that the same might happen with the Met’s crime statistics, I downloaded the lot. The development of “Technical Difficulties” by the Met will now be a waste of time.
While I was searching out statistics I encountered the most recent (2001) census data. Yes, I could use that (my ideas had already moved on from the Muslim calendar/crime correlations I had originally intended to look for). Everything written here is based on those two sets of documents: The Met. crime statistics and the 2001 census.
http://www.met.police.uk/crimestatistics/
http://www.statistics.gov.uk/census2001/profiles/rank/rank_ethnic.asp
And to access a borough map of
http://www.brent.gov.uk/www.nsf/0/243a9cb5fefb81e580256a560055e414?OpenDocument
From these three places you too could do everything I did – and probably more. All that’s needed is that you ask the right questions, and look at the data from a suitable distance and angle (averaging – as explained in my earlier posts – lumping together, and looking sideways at things. And counting, of course; mustn’t forget we counters ).
I had to get the sheer mass of numbers down to a manageable size, so, as the overwhelming majority of
That left nineteen boroughs to work with, and made the numbers far more manageable.
To make the numbers even more manageable I focused on a single crime category. Sex offences seemed a natural choice because all over the world there are reports of Muslims engaging in sex offences against non-Muslims (and other Muslims too, as it happens, where men have the cover of the Hudood Ordinances in Pakistan, or license from the government as in Sudan) out of all proportion to their numbers. Recent Australian events, and the scandal surrounding the Mufti of Australia were being talked about, I’d recently been reading Fjordmann’s work on rape in Scandinavia, we’ve all (?) read the reports on rape in Pakistan and Darfur, the slums of France, the “smileys” inflicted in the Netherlands, the grooming of under-age girls in Bradford; and I was, anyway, looking for an offence-category that could not be linked to personal economic circumstances. There are already enough confounds in the data without having that as a position for people to argue from (some idiot would claim that being poor makes you more likely to commit an offence). So I chose that category: Sex Offences … partly for the above reasons, and partly because I believe it will strike an emotional chord with anyone likely to read this post. It would be as well to note that in this context, “Sex Offences” in the Metropolitan Police statistics comprises two sub-categories: rape, and ‘other sex offences’; the actual rape figures are only a small part of the numbers I have used, which are for ‘Total Sex Offences’. Borough-by-borough, month-by-month, for 78 months in a row. Is any idiot going to argue that forced manual, oral, anal or paedophile sex, and whatever other things sex offenders get up to, are not serious sex offences, and so shouldn’t be used here? I haven’t even looked at any other offence category in relation to this work. I did not keep looking at different categories until I found one to bash Muslims with. This was the first and so far only category I’ve looked at. But as it turns out, I am going to bash the Muslims with it. “There’s lucky for you”, as we would say back home in
What I have is, if not actual proof, then a whole series of correlations. However, on the basis that if you can’t actually prove something fell out of the back end of a dog, but it looks like it did, smells like it did, feels like it did, and tastes like it did, then it might be best if you didn’t step in it, I’m going to publish what I found. You can make your own minds up. I’ve made mine up, and I wouldn’t want my daughter or nieces living near large numbers of Muslims. I think most reasonable, reasoning, people will agree after reading this.
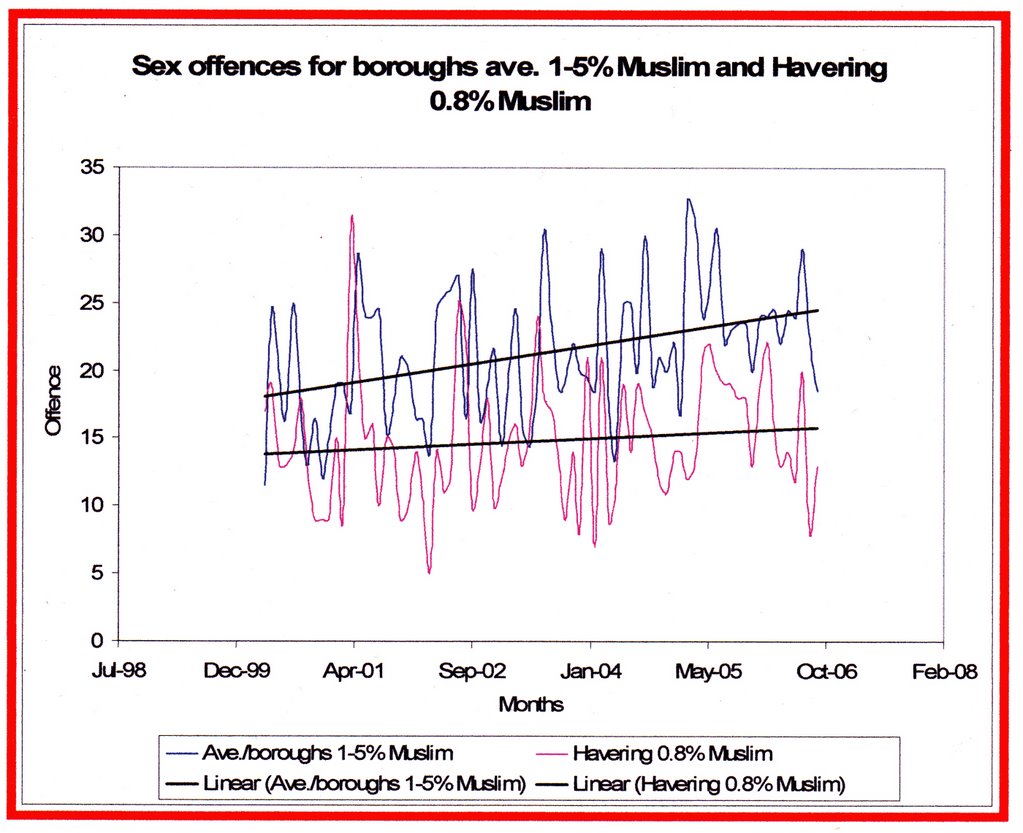
First I had to establish a baseline level for offences within a relatively homegeneous British community. I used Havering, right at the far east of
This is what I found:
graph 1
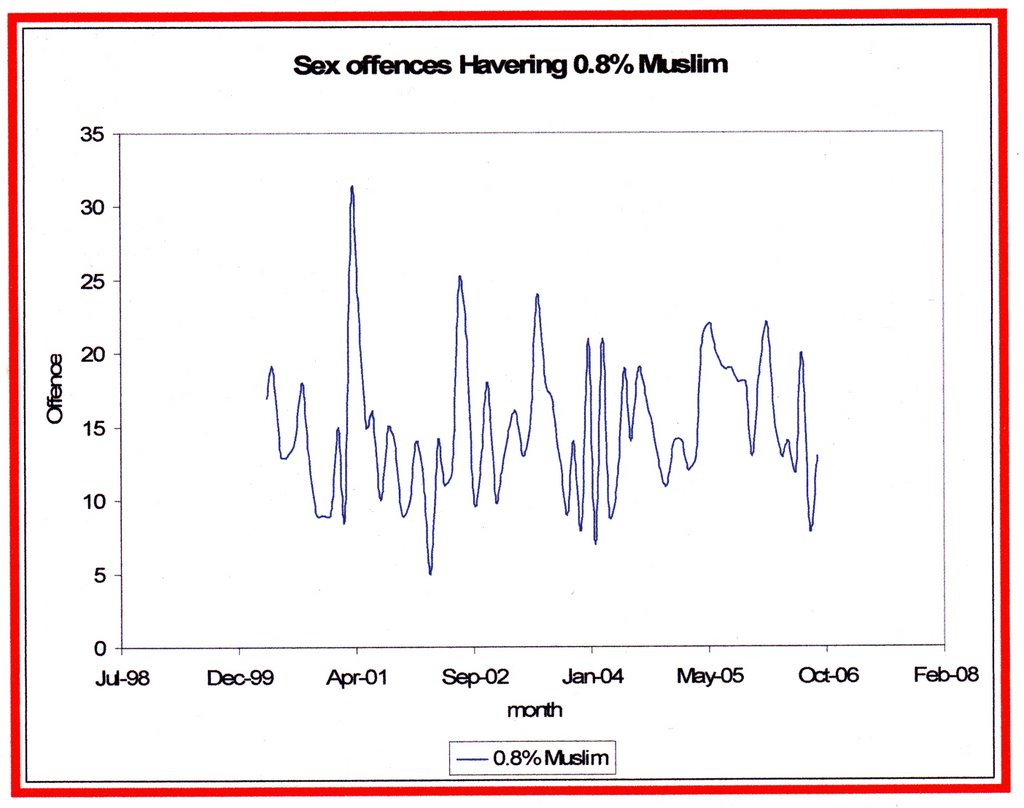

No, it doesn’t make any sense to me either. Just a squiggly worm trail across 78 months’ worth of data. Ok then, let’s go take a look at the borough with the highest proportion of Muslims in
Graph 2

Frankly, I can’t make out any difference between the two. Can you? Well, actually there’s a huge difference, but it depends on where in those graphs your eye is focusing. Let’s add trendlines, first to the Havering graph:
Graph 3
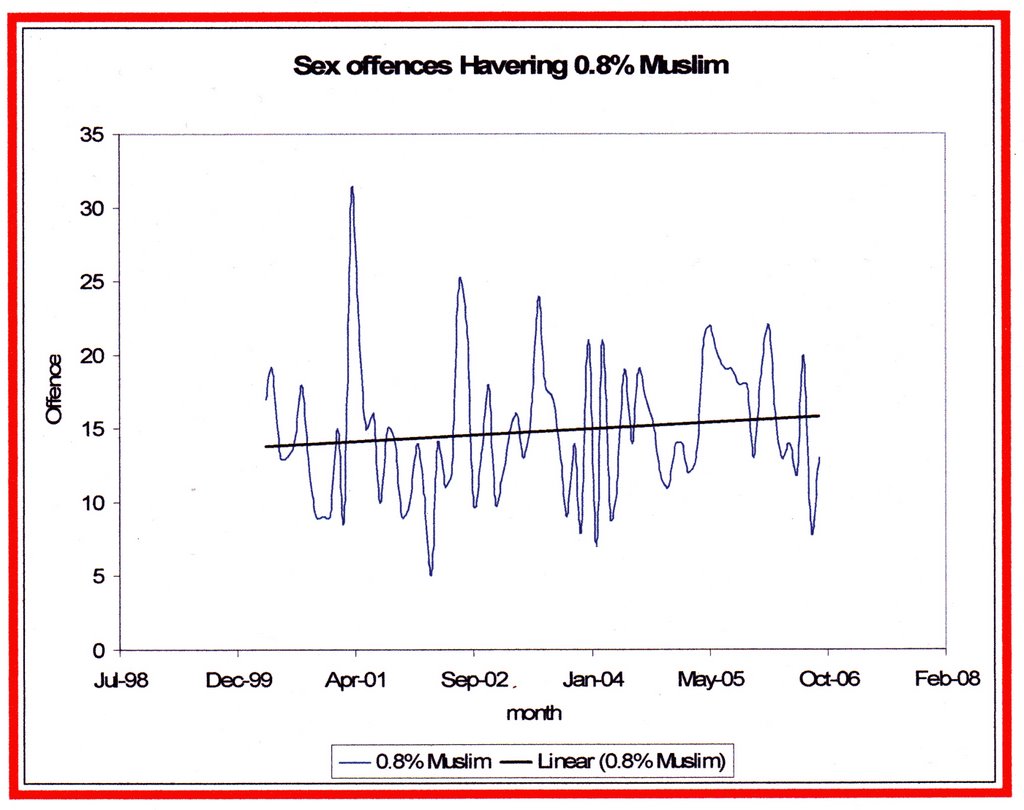
Seen it yet (come on, fair play, I put a lot of work into this, let me have a bit of fun with you)? Ok then, let’s add a trendline to the Tower Hamlets graph.
Graph 4

Surely you can see it now? No? Then you’re looking in the wrong place. Look at the numbers up the y-axis. Yes, that’s right, the graphs might appear indistinguishable, but actually, the borough with 36.4% Muslims has well over double the number of sex offences as the borough with only 0.8% Muslims. Well over double. Let’s put them both on one graph to make it absolutely clear.
Graph 5

You might expect offences to rise with a rise in population level? Well yes, you might at that. But in this case you’d be wrong. Havering has a higher population than Tower Hamlets: going from figures in the last census – admittedly five years ago, but it’s the latest available - and working to the nearest thousand, Tower Hamlets, with much more than double the sex offences, has only 196,000 people to Havering’s 225,000. What Tower Hamlets has more of is Muslims.
I wont mention population level again, or density, until later when I come to deal with them both as potential confounds. Neither can account for the differences in offence levels we’re about to run through. Nor can the presence of other religious groups (to the contrary – you’ll see).
What about the borough with the next largest proportion of Muslims, Newham, with 24.3% Muslims?
Graph 6
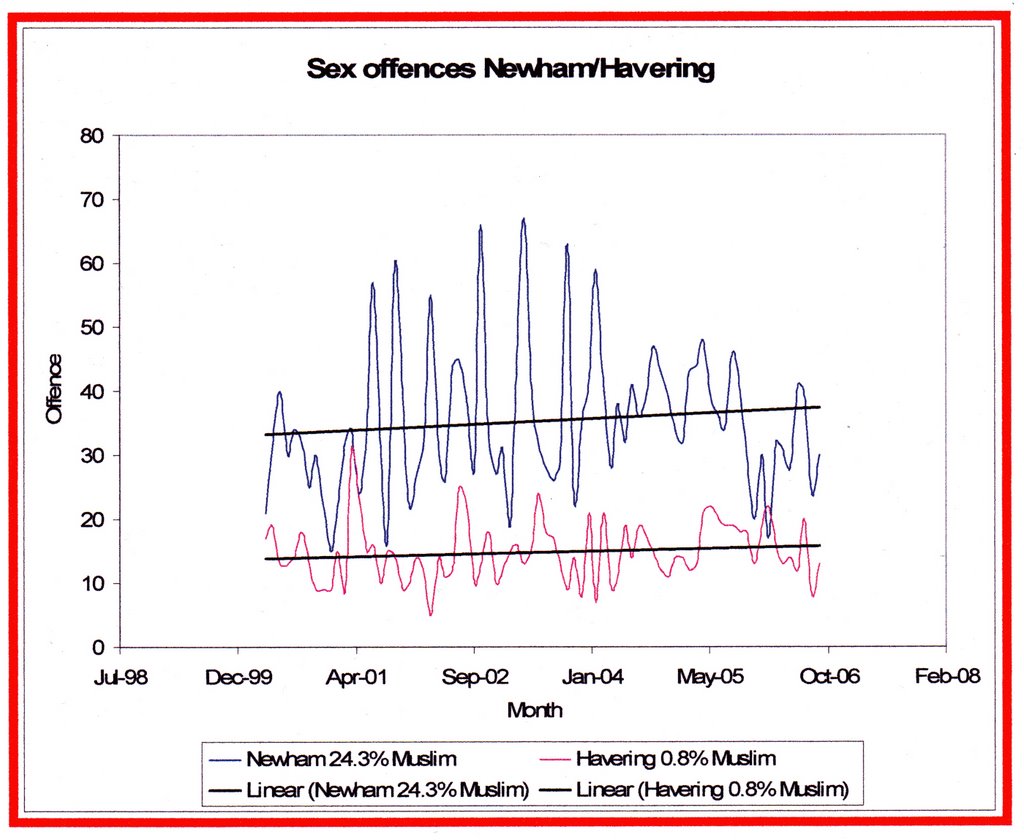
An even bigger gap! Very nearly two and a half times as many sex offences. Newham was recently declared the least desirable place in
So we’ve looked at boroughs with 30%+ Muslims and 20-30% Muslims. How about boroughs with between 10-20% Muslims? I’ve had to average across seven boroughs for this, ranging from 10.3% Muslims to 15.1% Muslims; from outer boroughs like Redbridge and Waltham Forest, to inner areas like Hackney and Camden (look at the map – you have the link)
Graph 7

Well, there’s a slight reduction in the gap (don’t forget, you’re supposed to look at the numbers up the y-axis as well as the trendlines), but not by much. I did try adding in the discarded borough,
Remember, I’m using Havering as my baseline for what could be considered a standard “normal” native British level for this sort of offence – only 0.8% Muslim.
Let’s take a look at boroughs with between 5-10% Muslims (there is a purpose to all this)
Graph 8
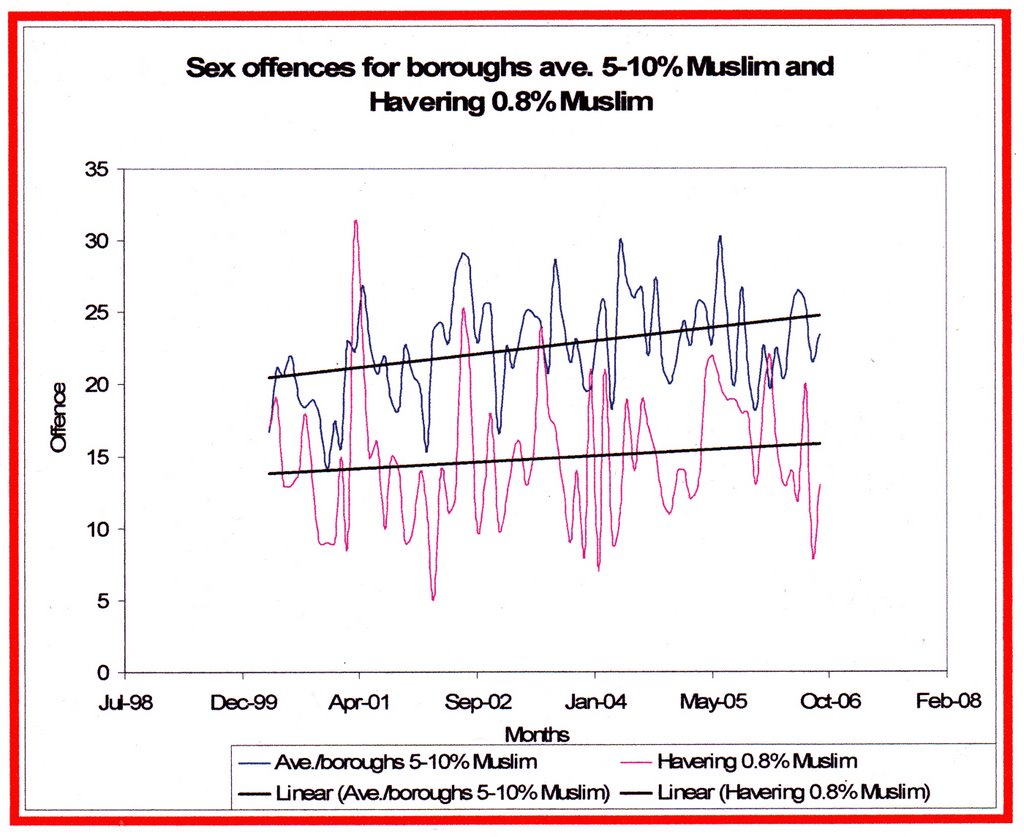
Well, the gap’s down a bit more, but it’s still substantial isn’t it. For those boroughs with between 5-10% Muslims I again had to average across seven boroughs ranging from 6.2% to 9.6% Muslims, and outer boroughs like Hounslow over on the west, Harrow, Barnet and Enfield to the northwest and north, to inners like Hammersmith or Kensington.
Now let’s examine the difference between boroughs with between 1-5% Muslims, and Havering with only 0.8% Muslims (I class that as “below 1%” in my worksheets).
For this I had to average only two boroughs: Hillingdon over on the far west side of
Graph 9
It would be as well to ignore the sqiggly worm tracks on that graph and focus on the trendlines, otherwise you run the risk of developing the Catherine wheel eyes I’ve now got (and raw bald patches with headaches). Squinting Catherine wheels at that.
Well, again that’s a much reduced gap, but it’s still substantial.
So, we can conclude from all that that there is a definite pattern to sex offence levels. But is it as simple as that, I wondered? I already told you: I’m a counter; I count left to right, right to left, top to bottom and bottom to top. Count in twos, threes, fours (I hit difficulties with fives – my Magical Number Seven plus or minus Two ... seems actually to be minus Three …google the phrase). What this means is I look for patterns, and patterns within patterns. All part of being a counter.
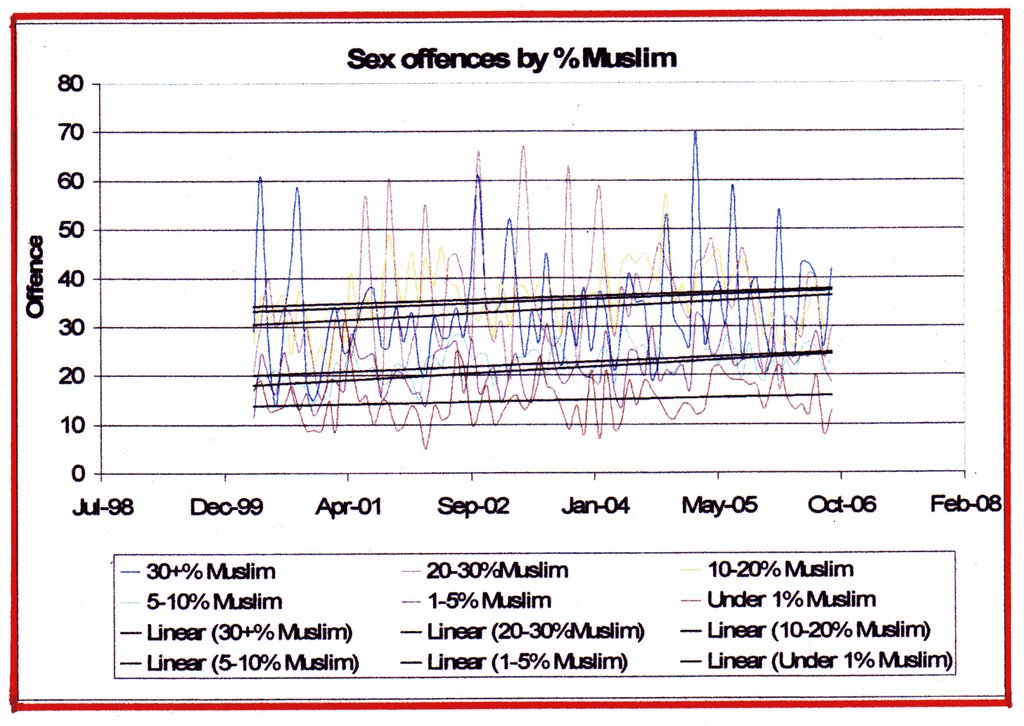
So are there any patterns here within that basic pattern of a rising proportion of Muslims equals a rising level of sex offences? Let’s look at all of the above on one graph and see what it throws up. And now you really are going to have to ignore the squiggly worm tracks and focus on the trendlines or go mad as a hatter… and/or blind. Even a counter like me can’t handle this next lot of squiggly worm tracks.
Graph 10

Well well well, isn’t that interesting … can you see them? Step-changes, two of them. Wonder if that’s just part of a larger pattern of step-changes as Muslim proportions get even bigger? But that’s speculation, and I’ll get back to it in a short while. You have absolutely no concept of how fascinated I was by this picture the first time I saw it. Well, some of you might have – that’ll be those of you who are like me … you know who you are. The possibilities …even now I keep getting drawn to it, and contemplating. Hard to drag my eyes away. I would be really interested in knowing what the % Muslims was in the Paris Banlieus when they first started behaving intifada-style, and how long ago it was; I’ve only had this level of communication and information for exactly seven months (that’s how long I’ve had a computer – I was reliant on being misled by the msm up to that time) – can anyone help me with information about this?
First a bit of explanation of what we’ve already got:
The very top trendline is the one for 20-30% Muslims.
The second from the top is for 30%+ Muslims.
The third from the top is for 10-20% Muslims.
The bottom trendline is for less than 1% Muslims.
The next one up is for 1-5% Muslims.
The third from the bottom is for 5-10% Muslims.
The top three are plainly patterned as a group. Relative to percentages there is very little difference between them. The group starts when the proportion of Muslims reaches about 10%. This is even more obvious if the missing borough (
The second and third up (1-5% - and 5-10%) are also patterned as a group. I would guess, though it’s hard to be as certain as with the top three lines, that 5% is another step-change, though a minor one. It seems obvious to me though, that 10% Muslim is a critical mass (and how often have we heard that expression used, but never with any hard evidence to demonstrate its reality?) where behaviour changes and remains at a particular form and intensity until the next critical mass is reached. Where is that next, higher, critical mass? It certainly hasn’t been reached by 35% on the evidence here, but I’d guess it’s getting close. Please, someone, information about
The bottom trendline is plainly all on it’s own, and nothing much is to be said about it other than to wonder how much more pleasant and safe city life might be if nowhere had more than 0.8% Muslims.
If I’m correct and there are indeed two step-changes here, then that demonstrates the existence of a pattern of step-changes, and there will be others where different things happen. So it’s not as simple as an all-or-nothing one-time-only critical mass where everything happens at once. This does need looking at. More data required.
Extra graph.
And doesn’t that just make it so much clearer that the top three trendlines are patterned as a group. And now the order is:
Top trendline 10-20% Muslims
Second down is 20-30% Muslims
Third down is 30%+ Muslims.
It also makes it clearer that the second and third from the bottom are also patterned as a group. So, two step-changes then; two critical masses. One at about 5% and one at about 10%. Is there a next one too? And if there is, what level is it at?
And if this doesn’t convince you that 10% Muslims is a critical mass with there being essentially a step-change, with no further change up to at least 35%, then nothing ever will. Now forget I did that – I just violated my own rule about leaving out the
Now then, we have to consider some of the possible confounds in the data that may be leading me astray here. For example, it may be that increasing levels of population lead to increasing levels of sex offence. That intuitively sounds reasonable to assume, and it may be that my earlier example with Havering and Tower Hamlets is an anomoly. But was it an anomaly? Let’s take a look at another trendline – the one that tells us whether or not there’s a general trend for increasing population inevitably leading to increasing sex offences. The x-axis divisions on this next graph are: “1” is population up to 200,000/borough, rising in 25,000 increments to “5”, which is: above 275,000/borough.
Graph 11

As we can see, the highest numbers of offences occur at both the highest populations/borough and the lowest. The trendline is horizontal. Neither positive nor negative correlation. That means there is no general trend for necessarily increasing sex offences by increasing population level. Population level is not a necessary determination of sex offences level. So that possible confound doesn’t need to be worried about. They can’t get off the hook by claiming their boroughs have the highest sex crimes just because they have the highest populations (they don’t necessarily have the highest populations anyway).
Ok then, another intuitively sound possibility is that sex offence levels could be determined by population density levels. That does sound sensible. But is it? Let’s take a look. In the next graph, on the x-axis “1” is up to 50 people/hectare/borough, rising in increments of 25/hectare/borough up to “5” which is 125+.hectare/borough.
Graph 12
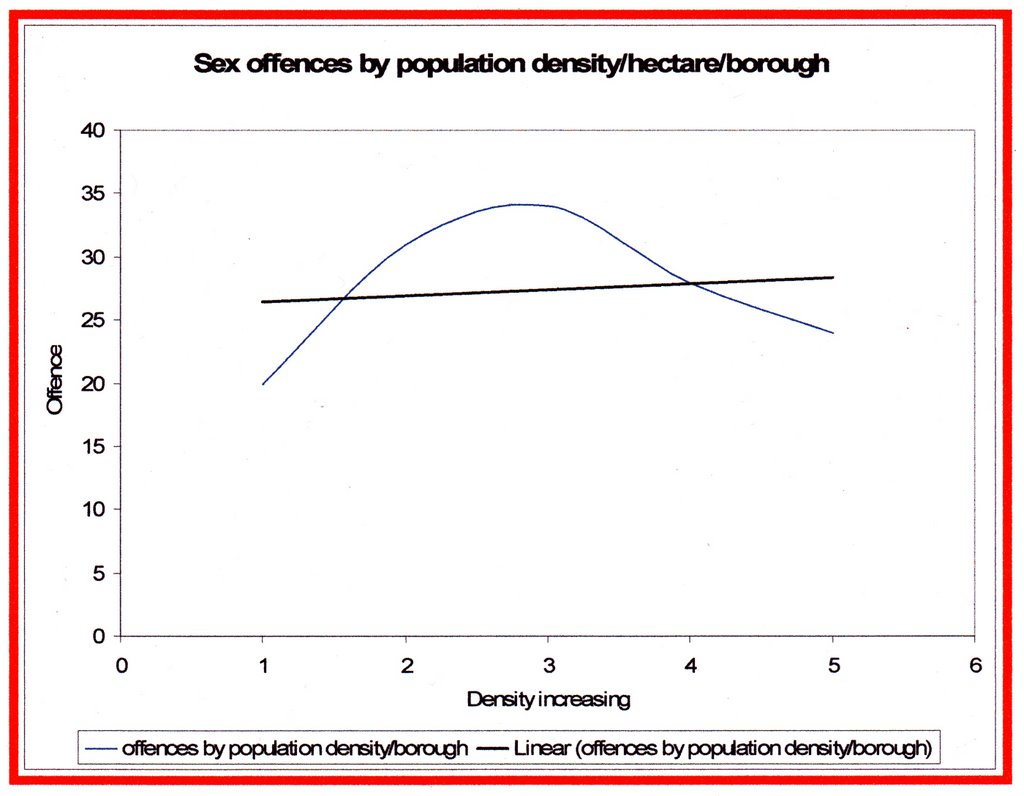
As we can see, the lowest numbers of offences occur in both the lowest densities and the highest. The trendline is slightly rising – a weak positive correlation - showing that population density does have an effect on level of offences, but as the trendline rise is only slight, and as some of the lower offence level boroughs are at the highest density levels, then the positive correlation is weak. Population density does have an effect, but only a weak one. In my judgement, nowhere near enough of an effect to account for the gross disparities in offence levels that we have seen correlated with the various levels of % Muslims/borough. For example, Newham, one of the worst offence-level individual boroughs (20-30% on multi-line graph above), is only eighth most dense of the boroughs we are considering here. The single most densely populated borough, Kensington, is only at the mid-range of offence levels. So this is a factor, but only a weak one.
Now let’s take a look at trendlines and correlations for level of sex offences according to percentages of the various religions in each borough. First we’ll take a look at the topic of discussion: Muslims.
“1” on the x-axis represents boroughs with up to 5% Muslims, “2” is 5-10% Muslims, “3” is 10-20% Muslims, “4” is 20-30% Muslims, and “5” is 30%+ Muslims.
Graph 13
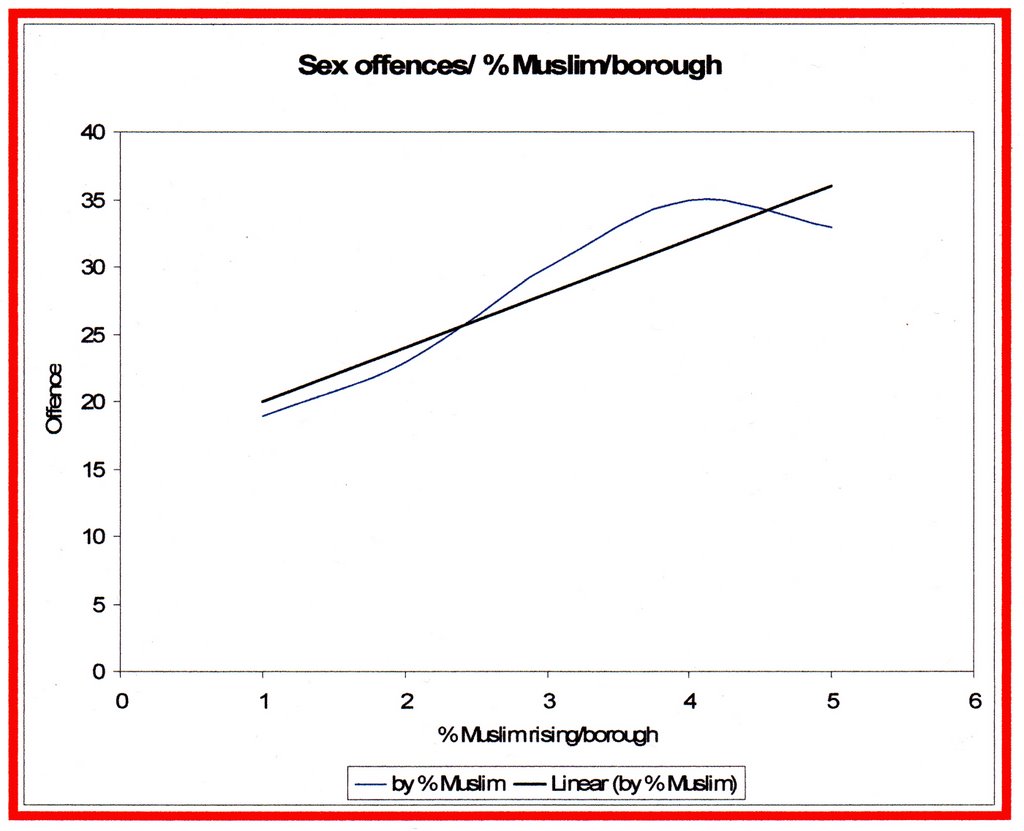
Well, that seems pretty clear to me – a sharply rising trendline: more Muslims means more sex offences. A strong positive correlation. Unquestionable. I would not let my daughter live amongst these people. Oh, ok then – she’s an adult now (just turned 18), so decides these things for herself, but I would strongly urge her not to, and explain why she shouldn't.
However, it could still be that I’m being unfair. After all, there are people of other religions too living in
In the picture that follows, on the x-axis, “1” represents boroughs with up to 40% Christians/borough, increasing in increments of 10% up to “5”, which represents 70%+ Christians.
Graph 14
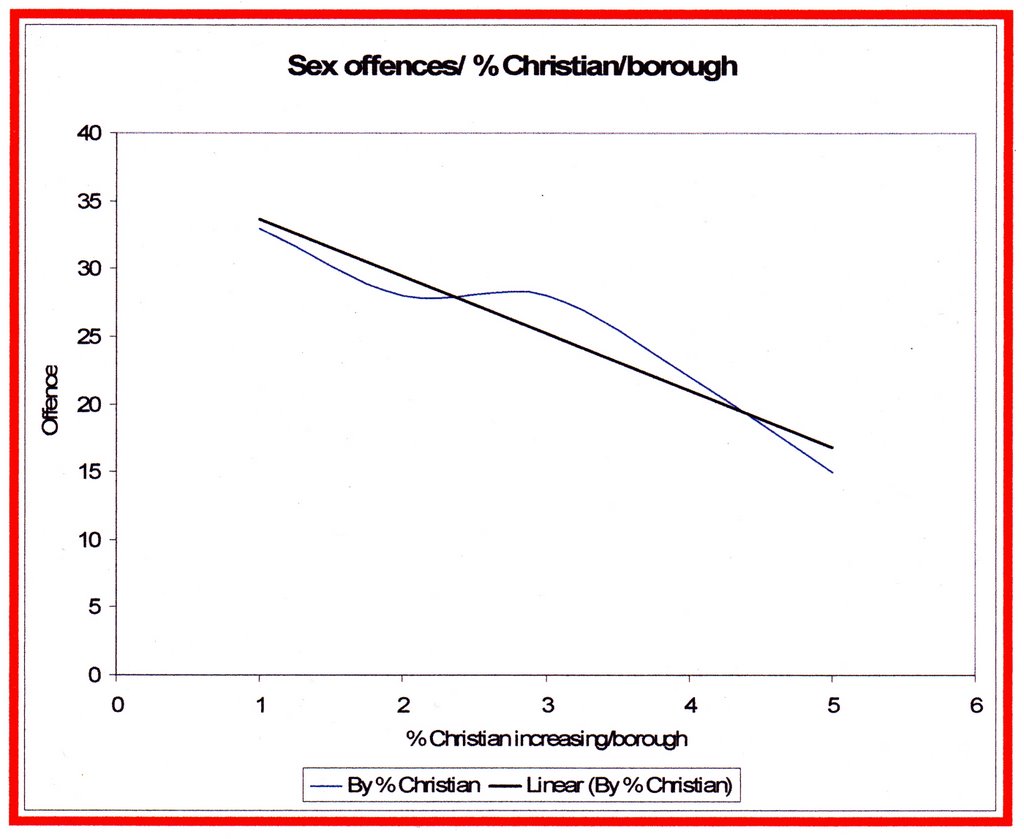
Oh dear! It’s ok folks, only jesting. A sharply falling trendline. A strong negative correlation. Thehigher the %Christians in a borough, the fewer the sex offences. Unquestionable. Yes, I’d be quite happy for my daughter to live amongst these people. Nothing to see here, move along please.
Of course, maybe I’m still being unfair. After all,
Here I encountered a problem: there aren’t high enough percentages of these other religions anywhere to show an effect that isn’t swamped out by the effects of the numbers of Christians and Muslims. So what I did was to combine them all to reach percentages powerful enough to work with. The following graph represents Jews, Hindus, Sikhs, Buddhists, and all those who either witheld their religious convictions, or weren’t in sufficient numbers to get an individual classification during the census, and are classed simply as “Other Religions”. So, is there a correlation between the % of these other religions/borough and level of sex offences?
In this graph, on the x-axis, “1” represents up to 5%/borough, rising in 5% increments to “5”, which is 20%+/borough. So let’s take a look.
Graph 15

A moderately dropping trendline. A moderate negative correlation. So, the higher the percentage of other religions/borough, the fewer the sex offences. I’d be content for my daughter to live amongst these people too. It could be that had their numbers matched those of Christians then the trendline drop might have been steeper. Who knows? I’m content with what I found.
Conclusion?
More Christians – fewer sex offences.
More other religions – fewer sex offences.
More Muslims – More sex offences.
Let’s put these last three trendlines together in one place to visually see the contrast:
Graph 16
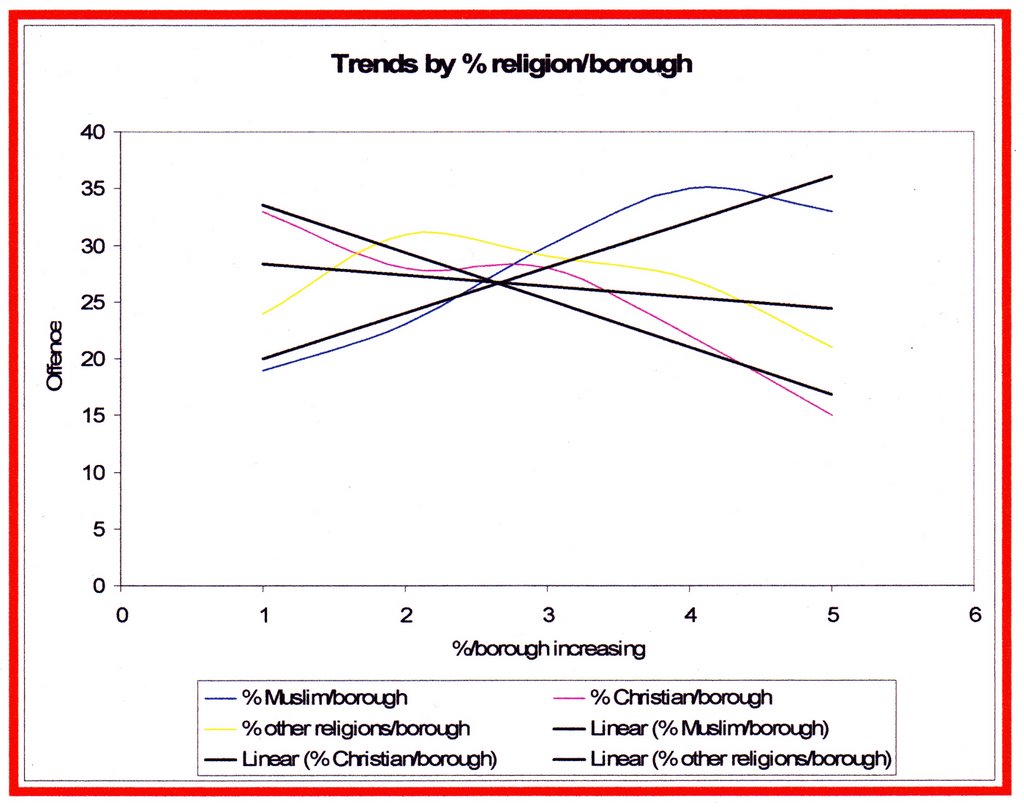
Muslim trendline rising sharply from left to right. Strong positive correlation!
Christian trendline falling sharply from left to right. Strong negative correlation!
Other religions trendline falling moderately from left to right. Moderate negative correlation!
This work is not proof of cause and effect, but the contrasting correlations couldn’t be starker and I need say no more, other than to repeat:
You may not be able to actually prove something dropped out of the back end of a dog, but if it looks like it did, smells like it did, feels like it did, and tastes like it did, then it might be best not to step in it.
I am going no further with this. I am not going to insult the unemployed, the poor, the uneducated by even considering any possibility that these things may be confounding factors in this picture I have presented. I could do, I have the data to use, but I will leave that to the PC brigade and whingeing Islam itself.
Talking of the PC brigade and Islam, there are those who will say this is little more than a hatchet-job: of course it’s a hatchet-job, you bloody fools. I’ve already established with my first two posts that we are at war with Islam, and when you are at war you must win. Against an enemy as ruthless and merciless as Islam you have to be even more ruthless and merciless or it will rip you apart – literally in Islam’s case. Consider yourselves lucky it’s not the historical Sir Henry Morgan whose emnity you have earned. He didn’t understand the concept of mercy towards his enemies. When he did a hatchet-job he did it physically and an impressive job he made of it too. Many of his enemies even referred to him as Hatchet-hand-Morgan. I’m sure our Spanish friends spanishdiplomat and callofthetrumpet could educate you in respect of this. At least I only do a metaphorical hatchet-job, but if I do say so myself, it, in its metaphorical form, is every bit as impressive a hatchet-job. I too do not understand the concept of mercy towards my enemies, and I will not quit until you depart our land for your own.
But then, is it really a hatchet-job? I have invented no numbers, faked no pictures. Everything done here has been done with official data publicly available. There is nothing here that didn't come out of the data. All I’ve done is looked at and treated it in particular ways and from particular distances. Exactly, those PC fools will say, it is just an artefact of the way you treated it, and not worth taking any notice of. Idiots – it’s not an artefact of the way I looked at and treated it: it’s a consequence of the way I looked at and treated it. What those same PC fools really mean is that they don’t like the consequence of looking at and treating the data the particular way I have done. I suppose they might not like the number 9 either, preferring 6 instead. That does not make 9 an artefact and 6 a consequence. They look at and treat a 3 and a 3 in such a particular way as to arrive at a consequence of 6 and they call it a consequence and right. I look at and treat that same 3 and 3 in such a different particular way that I arrive at a consequence of 9 and they call it an artefact and wrong. Am I wrong? Them right? Nonsense.
This work used
If the Metropolitan Police, or indeed anyone else, cares to dispute my findings, then perhaps it might be a good idea to release perpetrator/victim information regarding religion. Nothing usable to identify the people concerned, just information on religion. No doubt, this is information it is considered not PC to compile. Or perhaps just not PC to release?
I've no doubt it is possible to nit-pick holes in this work. However, I don't think it's possible to factually deny its basic very disturbing finding.It is a certainty that in certain circles accusations of racism will fly. So am I a racist? No, I am not. Can I prove I am not a racist? No, I can not. Nobody else can either, not even those who might make the accusation. It is a logical impossibility to prove a negative. That is why, in a court of law, the accused is never required to prove he is not guilty - because that would be requiring a person to achieve an actual logical impossibility. It is why the onus is on the prosecution to prove the positive - that the accused is guilty - because in logic such a thing is possible.
So no, I cannot prove I am not a racist any more than anyone else can. The only thing it is possible to do is provide testimony that one is likely to be innocent of the accusation. Me? I was married nearly a quarter century to a South Asian woman. My only child is herself half Asian. Why would I be racist when such a thing could only bounce back on my own? That is the best I can do, and it is at least better than the best most people can do which is a resort to "my best friend is ... ".
posted by Sir Henry Morgan at 10:12 AM
138 comments
![]()
![]()
