 Is Islam waging war on the world?
A question I’ve asked myself for a considerable time now is: is Islam waging war on the rest of the world? I read the same stories in the media that everyone else read, and apart from a few truly spectacular terrorist events that were well reported, and put down to the actions of “extremists”: nothing much. But I kept having that feeling, so I began to wonder if perhaps I was just paranoid. After all, I told myself, I read the Guardian from front to back almost every day from early 1982 until the Spring just gone. I also listened to BBC Radio 4 – to the virtual exclusion of all else, including television – every day for those same years. Every day I listened to one of Today, World at One, PM, Six o-Clock News, News at Ten, News at Midnight, and occasionally all six. I must be well-informed, I convinced myself, because these are two of the world’s premier media organisations; if there was anything to report, they would have reported it. Maybe I am just paranoid after all, I thought, because nothing I read or listened to confirmed the suspicion that led me to ask the question. And through all this listening to Politically Correct journalists and politicians, I had become as politically correct as the best of them. Or, perhaps I should say: worst of them.
Then, a little under six months ago, I bought a computer …
To smugly consider yourself exceptionally well-informed about current affairs – despite this sneaking suspicion about Islam – and then to discover that you have been in fact – one can only suppose deliberately - kept in utter ignorance is truly a shock to the system. The Guardian and the BBC, and all who work for them, have lost themselves a good friend and staunch defender. As has the rest of the mainstream media I should add, along with most of our political and social elites – undifferentiated by party or profession.
During all the ins and outs of learning to find my way around the internet, I encountered, quite by an accident of curiosity, a place called “Western Resistance”, which really opened my eyes to Islam-related events in the world That, in a roundabout way, led me to another place called “Religion of Peace”. There I found a list of all Islamic terror attacks worldwide since September 11th 2001.
Pretty much all that follows comes from that list, which is updated on a daily basis. It makes horrifying reading: horrifying in the details of the attacks it describes; and also horrifying in how it quite clearly demonstrates the ignorance our media, and political and social elites, keeps us in.
Initially, I couldn’t make a lot of sense out of this undifferentiated list of attacks.A little under six thousand attacks in five years. It was just line after line of text. You could make yourself dizzy just looking at it. So I downloaded the lot, and reformatted them into a word file, separating the text of each attack, for easier reading. 278 pages A4, font size 12. It’s a lot of reading.
I became obsessed with these lists. What are they telling me, I asked myself?
Now then, you can pretty well divide humanity up into two types of people: counters, and non-counters (and wont a psychologist have fun with this one). Me? I’m a counter. For example, when I walk into a room I’ll start counting things; first I’ll count them top to bottom, then side to side, I’ll count those same things in pairs, groups of three, fours. I just count in lots of different ways. I started counting the lists in different ways, and started deriving new lists from the originals.
One set of the derived lists was just numbers. No details, numbers only. I made a list of the number of attacks each month for the five years from September 2001 to August 2006. Sixty months. A convenient number, as you will see.
I could vaguely see that attacks were higher now than five years ago, but I still couldn’t make a lot of sense of it. It was just a mass of numbers making me even dizzier than I already was. Brainwave – make a picture! Look at what I found: these are the Islamic attacks worldwide on a monthly basis.
Graph 1
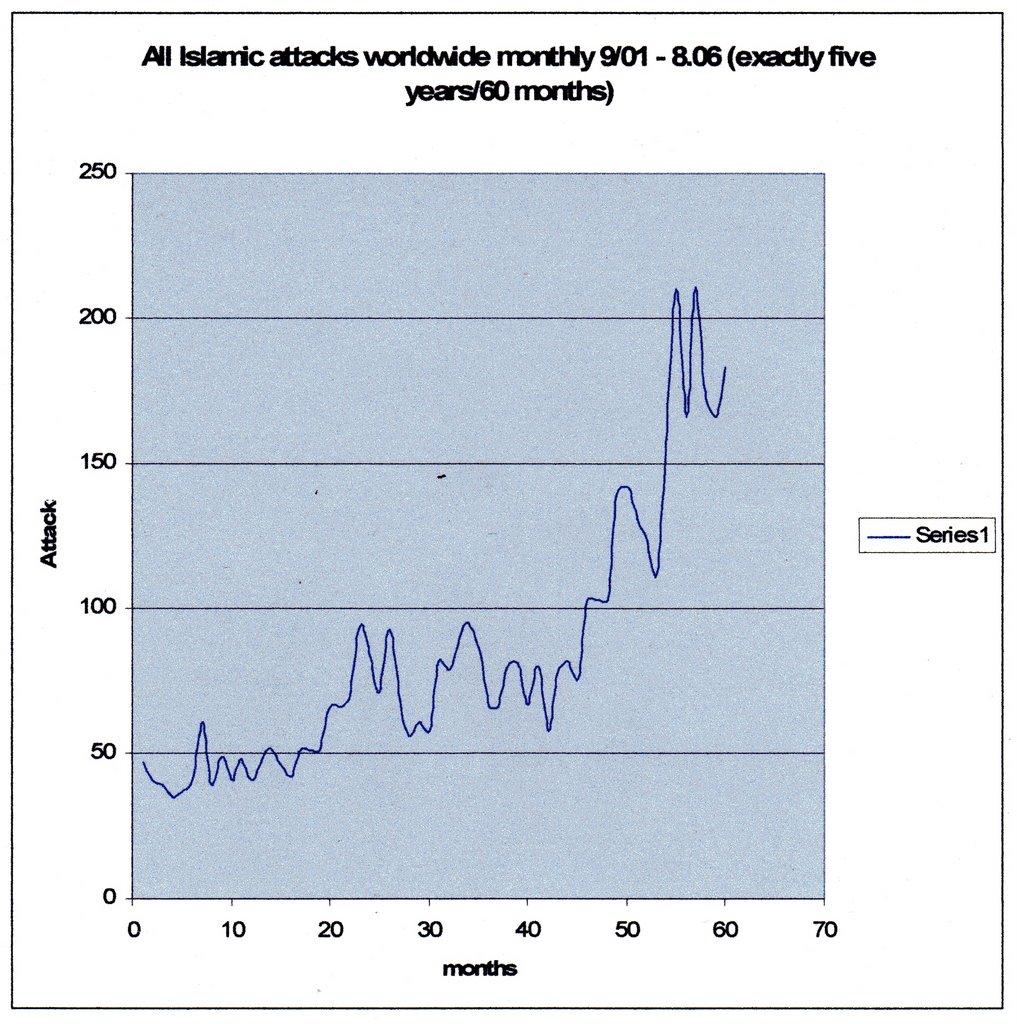
Yes. Informative. Getting a better idea of the problem. From something well under fifty attacks a month five years ago – which is only about twelve a week worldwide, it’s now between 150 and 200 attacks a month, and has twice broken through the 200 line in recent months. But surely it’s just the horror in
Nothing of the sort.
Graph 2
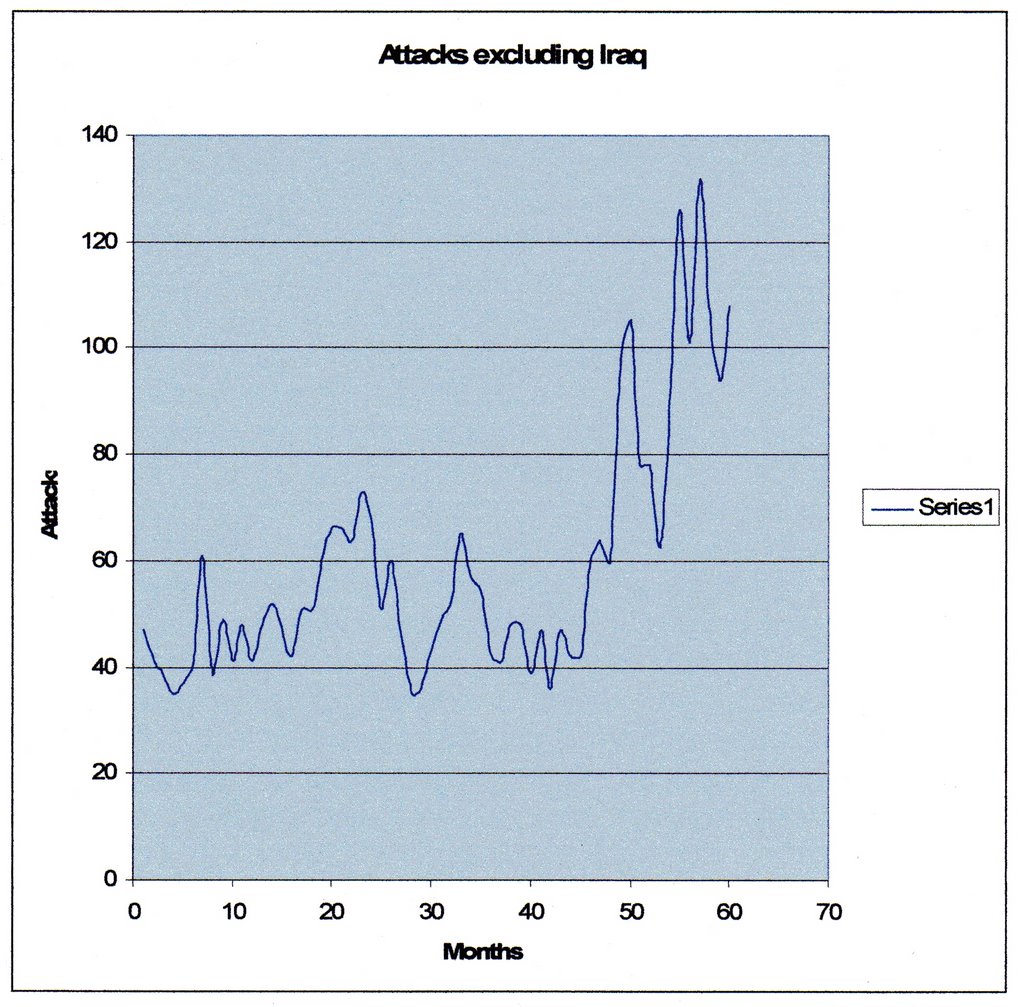
Well, the absolute numbers were down, but I couldn’t discern any real difference in the pattern. My nose was beginning to tell me that there was a smell here, but I couldn’t work out what it was. It certainly wasn’t what I at first thought it was:
Ok then. Perhaps it’s
No, not that either, it seems.
Graph 3

Well, again the numbers were down, but not by very much this time. But I was disappointed and getting increasingly frustrated. The pattern is unchanged; and apart from some small movement up and down the number scale, I found it rather difficult to discern any difference between these three graphs.
Have a think for a moment. Are you like I was? That is, did you think there has been a steady drip drip of Islamic attacks in
While I was going through all these numbers trying to work out why I couldn’t bring the line down to something resembling the horizontal, I suddenly – and it was a shock – noticed that before January 2004 there had not been a single Islamic attack in Thailand, but there has been an accelerating number of attacks there since that date. It looks very much like the deliberate opening of another front in the war. So of course, a picture being worth a thousand words, as it’s said, I made another picture.
Graph 4
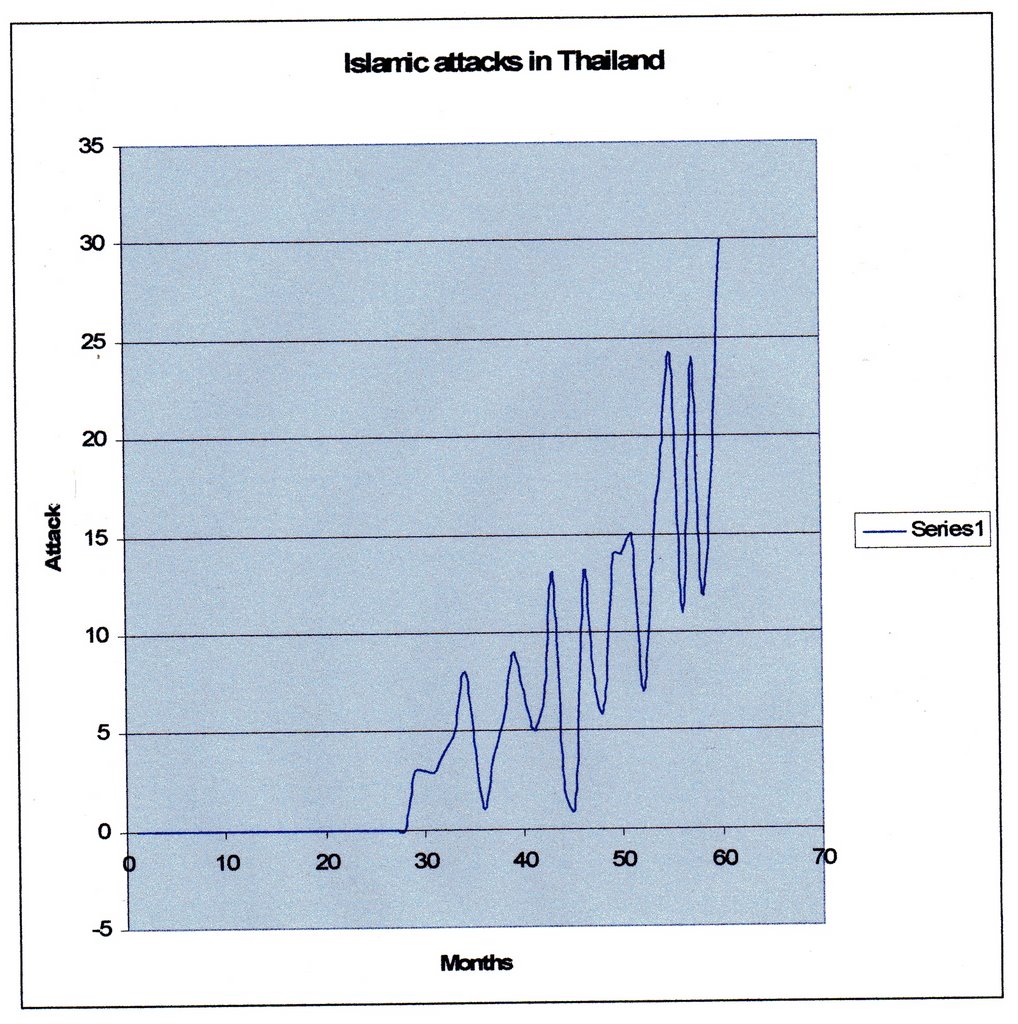
Ah! Got it, I thought. That must be why I couldn’t bring the line down.
Digression. Let’s consider this picture for a moment. My downloaded data hasn’t been analysed for this month, but I’ve noticed that there have been only two attacks in
Compare that to the number of attacks in
I think it might be a good thing if a campaign was to be mounted demanding that the king of
Digression over. Now armed with what I was certain would bring that line down, I made another picture, of all attacks excluding
Graph 5.
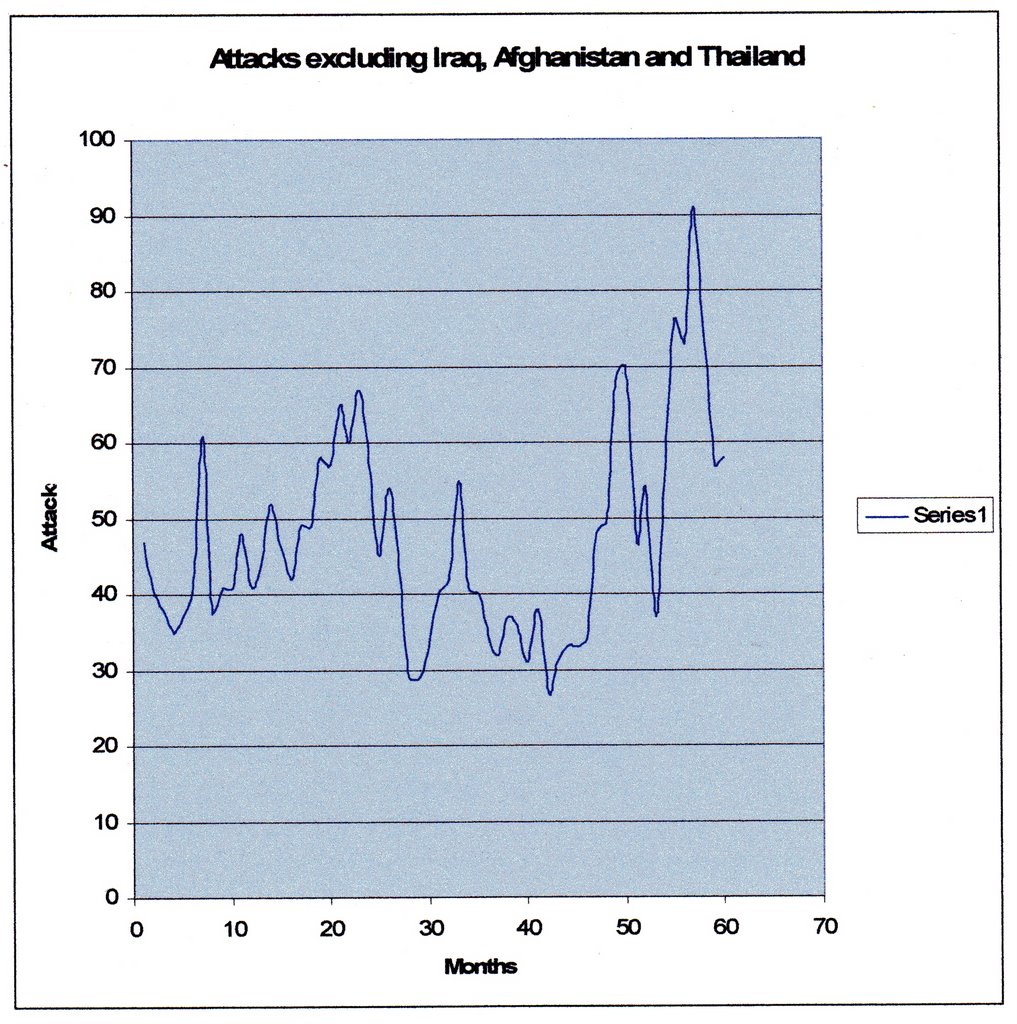
As would be expected, the actual numbers are down again. But yet again, that same pattern. Attacks in earlier months sometimes dropping below thirty per month, but recently getting to up over ninety. So, we have many more attacks now than we did five years ago, even when we ignore
As the pattern remains unchanging no matter what I do, then from here on in, I’ll only draw pictures of all attacks. The pattern is consistent whatever we exclude, so why bother excluding anything?
If anyone wants to draw their own pictures, e-mail me via my profile, and I’ll send you all the raw data. It’ll be slow if you’re on dial-up, because it’s by the megabyte. Indeed, if you just want the attack files in a more easily readable form than on Religion of Peace, then e-mail me and I’ll send them to you (including the one I call “Specials” – not for the faint-hearted: there is some serious sadism out there in the psychology of Islam).
Apart from being able to tell that attacks have increased over five years, the graphs are far too jerky, the numbers fluctuating, jumping about too much to get any more information than that from the data (well, at least for now. From the perspective of later knowledge, we’ll go back for another look). However, data is like the patterns of a work of art: what patterns you see, what you get out of it, very much depends on how far away you look at it from. You have to play with data. So I decided to look at it by averaging the attacks every three months, just to see what might pop up out of the picture. This proved to be rather productive.
Graph 6
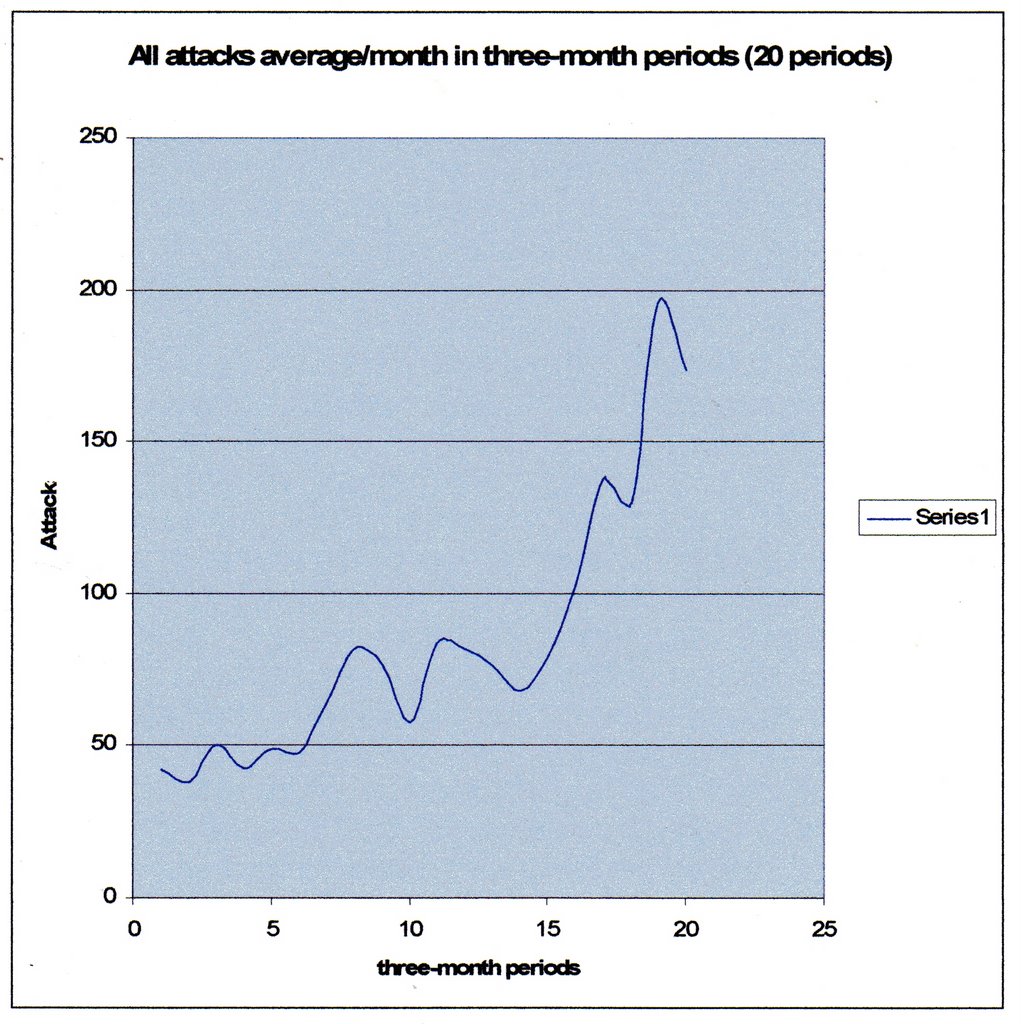
You can’t see how it’s much different from the pictures of attacks on a monthly basis? Ah, but it is very different. Something is very much clearer now. It was there to be seen in the earlier pictures, but with the line jumping about so much, it was difficult to see. Let me explain, and during the course of that explanation, we’ll revisit the earlier pictures, and armed with our new knowledge, we can extract yet more information from them.
From this picture it’s immediately apparent that the attacks come in surges, with a fall-back between surges, as if they’re girding their loins for the next surge. Every new surge goes higher than the one before, and every fall-back doesn’t fall back as far as the previous one. It also looks as if the height of the surges is accelerating – each one increases attacks by a greater amount than the previous one did. It’s not absolutely certain from this view, but we can return to it later. There is a ratchet in operation.
Also, you might have noticed that we are currently in a fall-back stage, and might be wondering when the next surge will start? Strange as it may seem, the world is currently experiencing a – relative – lull in terrorist attacks, with another surge about to begin. Well, that’s what it looks like from this picture, but let’s revisit the monthly pictures armed with this new insight.
Go back to Graph 5, and you can only just about discern that the lull is already over. There’s been an upturn, and we’re right at the start of another surge. If you go further back into graphs 3, 2, and 1, you’ll see that we’re actually well into it. I wonder how long this surge will go on for, and how high it will go? Hold onto your hats. As we’ve seen, this is not just Iraq, Afghanistan and Thailand: it’s the whole world, as evidenced by graph 5, which does not include those three places, though it must be conceded that Afghanistan, and especially Iraq, will most likely be where most – though by no means all - of the surge happens.
Recent reports of riots in
As you’ve just seen, when you look at the data from further and further away, you gain some information, you lose some information. There, we clearly gained the surge/lull information, but it happened that we’d lost the information telling us we’re not waiting now for the next surge to start:we’re already into the beginning of it.
We can also extract a little more information from this latest picture.
Several times in the past year or two, both politicians and media have claimed that attacks are reducing, that we’re getting on top of the problem. Well, at the times they said it they probably genuinely believed it – because as we’ve seen, between each surge there’s a fallback, and during the fallback, of course, attacks are reducing.
Their problem is that they don’t see the data from far enough away, or over a long enough time period to get a proper picture. They see some apparently good news, on a short-term basis, and rush to get it out to us to convince us of something we can’t be convinced about: that they know what they’re doing. Are they wilfully blind? Or just stupid. I’ll leave that one to you.
There is still a question hanging from that last picture: are the attacks accelerating? It looked like they might be, but it wasn’t entirely clear.
Time to take yet another step back from the data, and look at it from a little further away. It might turn up the information we need to answer that question. Let’s look at a picture of the data averaging monthly attacks over six-month periods.
Graph 7

Well, it’s hard to tell whether that’s a positive (attacks accelerating), arithmetic (steady increase) or negative (attacks decelerating) curve. It looks very much like a straight line to me, but very steep. We have to take things as we find them. About the only new information we can find here is the surge/fall-back picture on a larger and clearer scale, though we have lost any sense of having currently gone into a fall-back, and just starting a new surge. If it is an arithmetic curve, it’s certainly a very steep one and is nothing to be optimistic about.
I’ll return to this issue of whether the attacks are accelerating when I have another six months’ data to work with.
In the meantime I have to conclude that I never was paranoid, and that there really is a war being waged by Islam against the whole world, and it is intensifying by the day. The main problem with it is that the leadership, and most of the population, of only one side in this war knows it. Or at least, knows the full extent of it. The leadership and most of the population of the other (our) side of it are, in psychological-technical terms, in Denial. Given the rate of increase in attacks, then though that might be comforting to them in the short-term, in the long term it may prove disastrous, though I cannot see that our side would ultimately lose. What the data does show is that the sooner this war is addressed as a war, and in respect of its full worldwide extent, the easier and less damaging to us it will be to win.
Recently, the Pentagon issued a report stating that our presence in
Another question that this data may contribute towards answering, is whether or not there is a controlling mind (organisation) conducting this war on the enemy’s behalf. I believe the data also contributes to an understanding of how they are conducting the war at a tactical level. The timing of the start of the terrorist attacks in
Also relevant: should we expect the opening of yet another front in this war? If that should happen, then there really will be no further room to doubt a controlling mind (organisation). There is no reason to suppose that this must be bin Laden and al Qaeda, though it could be.
Where is this war being conducted? Overwhelmingly it is in those places where Islam is present in force, though targets of opportunity are occasionally hit. That is clear from the written details of all the worldwide attacks. This carries serious implications concerning the large Muslim populations currently present in all countries of the Western world. This Muslim presence has to be addressed as a matter of urgency.
For those who might like to claim that all I’m doing is playing with statistics, and that you can make statistics say anything you want, I assert that I am not playing with statistics: you only play with statistics when you are calculating using a sample from a population (in this case, the population of Islamic terror attacks over the past five years). I am using the entire population – there is no need to use statistics. The numbers I use are the real thing. I just look at them in varying ways, that’s all.
Many thanks to Religion of Peace for compiling the data used in this work. If anyone considers this post to have been useful, and you have a little money to spare, go to Religion of Peace and make a donation.
http://www.thereligionofpeace.com/
http://www.westernresistance.com/
http://www.wnd.com/news/article.asp?ARTICLE_ID=52184
Question:
Should we make friends again with Saddam? Next post.
posted by Sir Henry Morgan at 4:39 PM
35 comments
![]()
![]()
